Course overview.
Join our Data Visualisation and Business Intelligence course to elevate your data interpretation skills and revolutionise the way you present and utilise data for better decision-making. This programme provides a dynamic learning experience with hands-on exercises and real-world case studies, ensuring you understand how to create compelling data visualisations that convey valuable insights. From data-driven storytelling and dashboard design to leveraging business intelligence tools, you will gain a comprehensive understanding of how to transform raw data into actionable knowledge. Enrol now to become a data visualisation expert and lead your organisation in leveraging the power of data to drive innovation and success in an increasingly data-centric business environment.
Who it's for.
This course is designed for data analysts, business professionals, managers, and individuals looking to enhance their data visualisation and business intelligence skills. It's also invaluable for organisations seeking to equip their teams with the knowledge and expertise needed to effectively communicate data-driven insights and make informed decisions. Whether you are an aspiring data visualisation specialist or a business leader aiming to leverage data for better decision-making, this course equips you with the essential skills to excel in the field of data visualisation and business intelligence.
What you'll learn.
Module 1: Fundamentals of Data Visualisation
In this foundational module, participants will explore the fundamentals of data visualisation, covering key concepts such as visual encoding, chart types, and effective storytelling with data. Through hands-on exercises and real-world examples, participants will develop a solid understanding of the foundational principles that contribute to impactful data visualisation.
Module 2: Advanced Data Visualisation Techniques
This module focuses on advanced data visualisation techniques, including interactive dashboards, geospatial visualisation, and advanced chart design. Participants will learn how to create compelling visualisations that communicate complex information and insights effectively. Through practical applications and case studies, participants will refine their skills in applying advanced data visualisation techniques to enhance business intelligence.
Module 3: Business Intelligence and Data-Driven Decision-Making
The final module explores the integration of data visualisation into business intelligence processes, covering topics such as data exploration, reporting, and data-driven decision-making. Participants will learn how to use data visualisations to extract actionable insights, support strategic decision-making, and drive business success. Through real-world applications and strategic discussions, participants will develop the skills needed to leverage data visualisation as a powerful tool within the context of business intelligence.
This course is fully fundable through ReACT+.
If you've been made redundant or are facing redundancy in Wales, the Welsh Government's ReACT+ scheme can fund up to £1,500 toward this course — plus childcare, travel and accommodation expenses. We'll handle the application.
Benefits of Attending This Course
Develop practical skills in data visualisation and business intelligence to transform raw data into meaningful insights. Learn how to build effective dashboards, communicate findings clearly and make data-driven decisions with greater confidence.
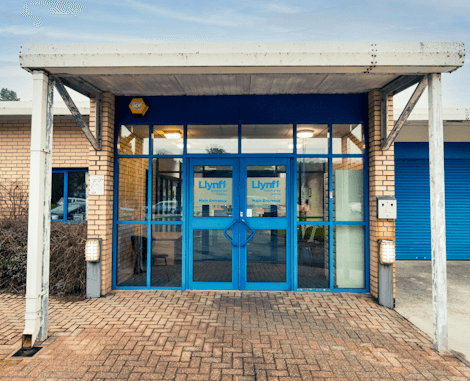
Ascent Training Wales · Bridgend.
Our conference room is purpose-built for effective training — bright, modern, and fully equipped for workshops, seminars and accredited sessions.
Llynfi Enterprise CentreHeol Ty Gwyn Industrial Estate
Maesteg, Bridgend, CF34 0BQ
Turn Data into Actionable Business Intelligence
Visualise Complex Data
Learn how to create clear, impactful dashboards and visualisations that make data easy to understand and communicate.
Generate Business Insights
Develop the skills to analyse data, identify trends and uncover valuable insights that support strategic decision-making.
Support Smarter Decisions
Discover how business intelligence tools and reporting techniques can improve performance, planning and organisational outcomes.
Common questions.
Quick answers to what most people ask before booking. Still need help? Get in touch.
How long is the course and where is it delivered?
How much does it cost and what's included?
When is the next date available?
Is this course eligible for ReACT+ funding?
Can you deliver this course in-house for our team?
From the classroom.
Our Bridgend venue is purpose-built for working learning — bright, modern, configurable for cohorts of four to twelve, with quality AV throughout and free parking right outside.

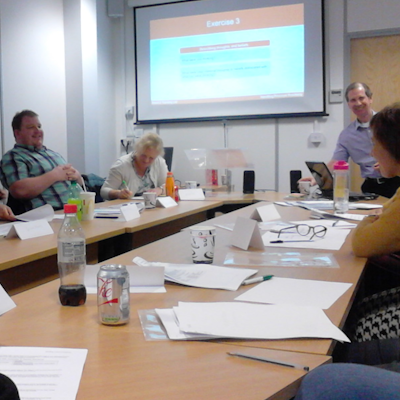


Llynfi Enterprise Centre · Bridgend · More about our venue →
More in Professional Development.
Courses that pair well with Data Visualisation and Business Intelligence Course, or that your team often takes as a sequence.


Ready when you are.
Book Data Visualisation and Business Intelligence Course for £275 a seat, or send us a brief and we'll come back with a tailored in-house quote for your team within two working days.